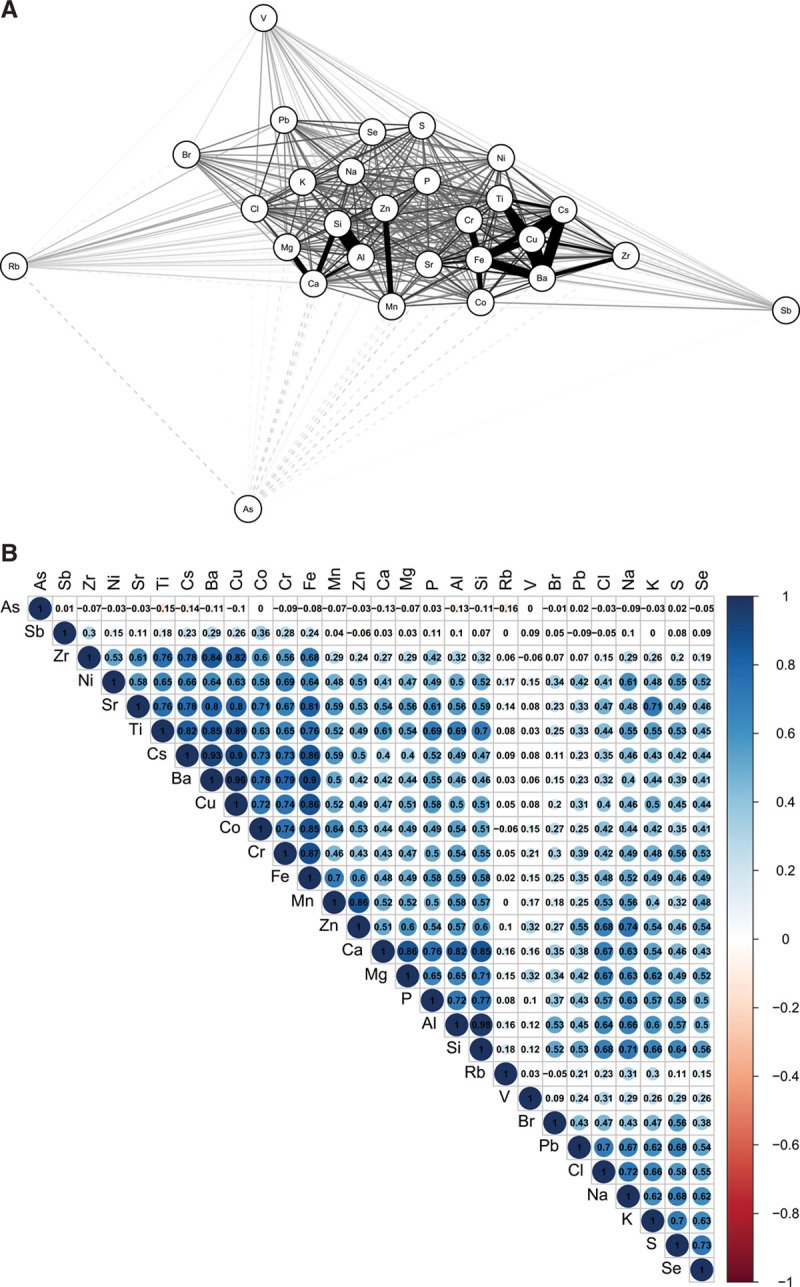
Figure 1.

Correlations between PM2.5 metals during summer. A, Network plot with more highly correlated metals grouped more closely together and linked by darker, thicker lines (dashed lines indicate inverse correlations). Numeric correlation values are illustrated in B.
