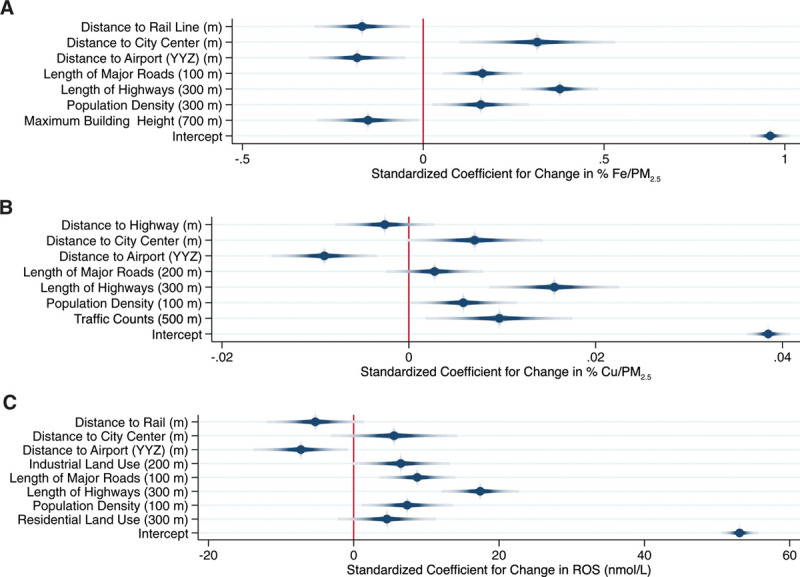
Figure 3.

Land use regression models for annual mean Fe (% mass) (A: Model R2 = 0.72; Cross-validation R2 = 0.68), Cu (% mass) (B: Model R2 = 0.81; Cross-validation R2 = 0.79), and their estimated impact on ROS (C: Model R2 = 0.71; Cross-validation R2 = 0.65) in Toronto, Canada. Dots and shaded lines reflect point estimates and 95% confidence intervals.
