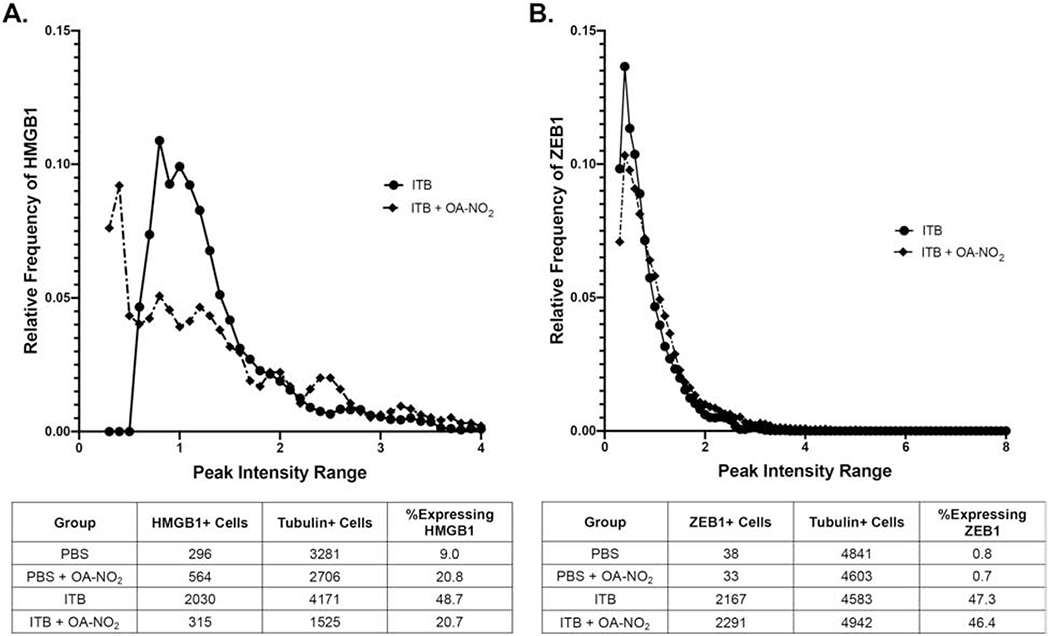
Figure 9.

Single cell analysis of CD45+ and CD45− cells within lung tissue. Cells isolated from digested lung tissue 7 d after exposure to PBS or ITB with or without OA-NO2 treatment were separated for CD45+ and CD45− cells as described in the material and methods. Single cell western blotting was utilized to visualize CD45+ cells that were expressing HMGB1 and the relative frequency of cells are expressing at a given intensity (A). HMGB1 is a marker of immune cell activation. This technique was also utilized for CD45− cells to visualize their expression of ZEB1, a marker of epithelial to mesenchymal transition (B). Cells were pooled from 8-9 individual mice and the data is representative of one single cell western chip per group.
