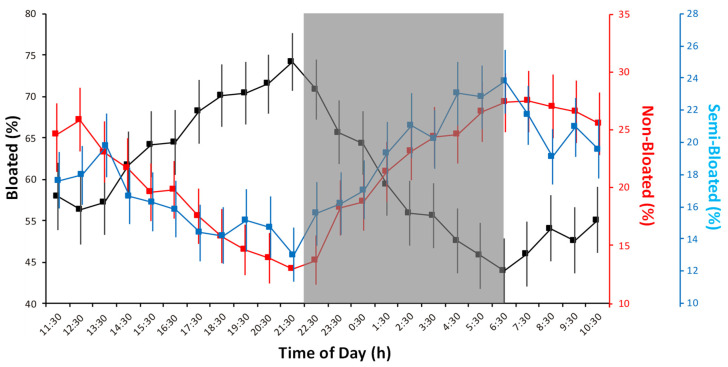
Figure 10.
Waveform analysis outputs as averaged percentages for colony surface with polyps in full extrusion (bloated) or full retraction (non-bloated) as well as the intermediate condition (semi-bloated) are reported with the standard deviation. A marked unimodal increase in bloated status (i.e., possibly corresponding to filter feeding activity) is evident in antiphase with non-bloated and semi-bloated statuses (see the MESOR threshold values in Table 3). On should notice that waveforms Y-axes have different scales to make time series pattern as visually comparable. The gray shaded area represents the hours of darkness.

