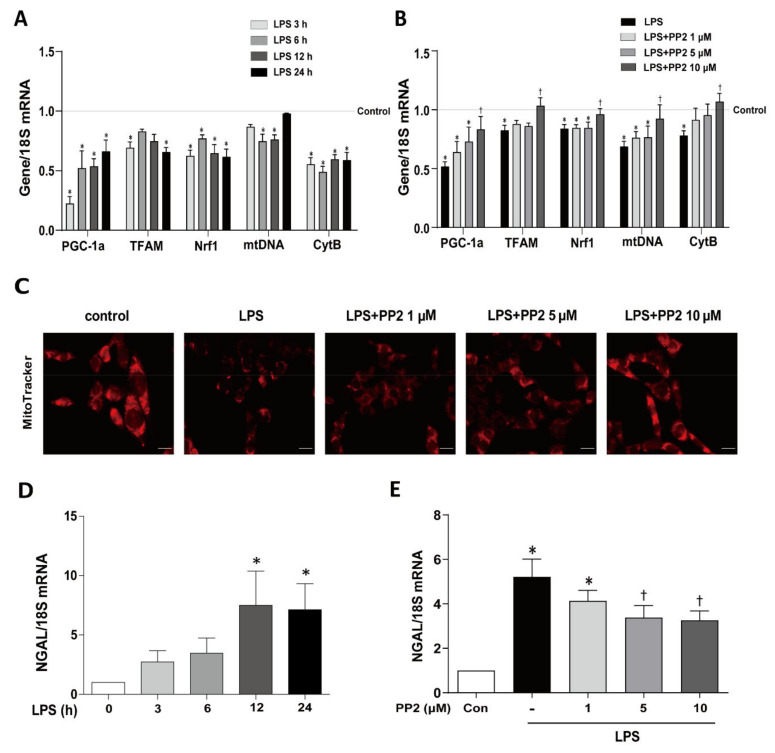
Figure 1.
PP2 maintains mitochondrial biogenesis in mProx cells. (A,D) The mProx cells were stimulated with lipopolysaccharides (LPS) in a time-dependent manner (0, 3, 6, 12, and 24 h). (A) The mRNA levels of mitochondrial fitness markers such as PGC-1α, TFAM, Nrf1, mtDNA, and CytB were measured. (B,C,E) The cells were pretreated with PP2 (0, 1, 5, and 10 μM) for 2 h and then stimulated with LPS (100 ng/mL) for 9 h. (B) The mRNA levels of PGC-1α, TFAM, Nrf1, mtDNA, and CytB were measured. (C) The mitochondria in mProx cells were labeled with MitoTracker staining. (D) The mRNA levels of NGAL were measured in mProx cells after LPS (100 ng/mL) stimulation in a time-dependent manner (0, 3, 6, 12, and 24 h). (E) The mRNA levels of NGAL were measured. The levels of mRNA expression were measured using real-time RT-PCR analysis and normalized with 18S. Data are presented as mean ±SE, n = 4. * p < 0.05 vs. control. † p < 0.05 vs. LPS.

