
Figure 4.
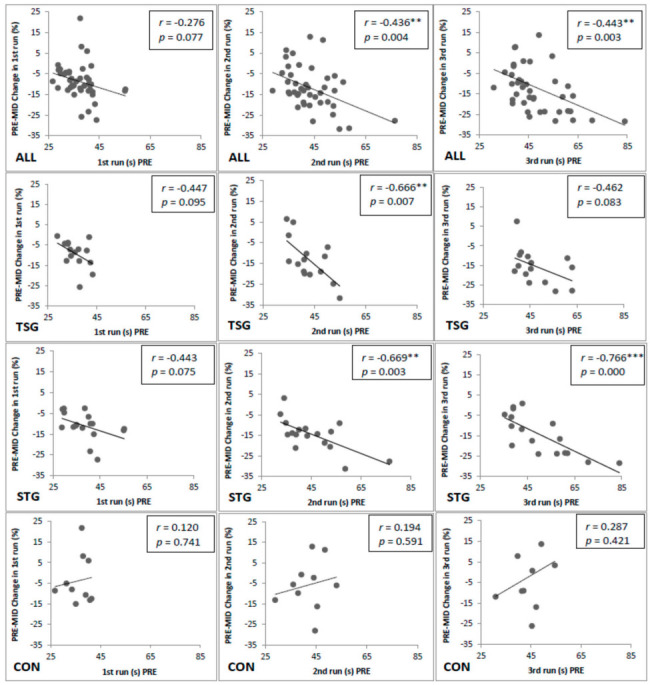
Correlations between absolute time in the 1st, 2nd, and 3rd run and the PRE–MID change (%) in time. ALL = all subjects; STG = strength training group; TSG = soldier task specific group; CON = control group; * = p < 0.05, ** = p < 0.01, *** = p < 0.001.