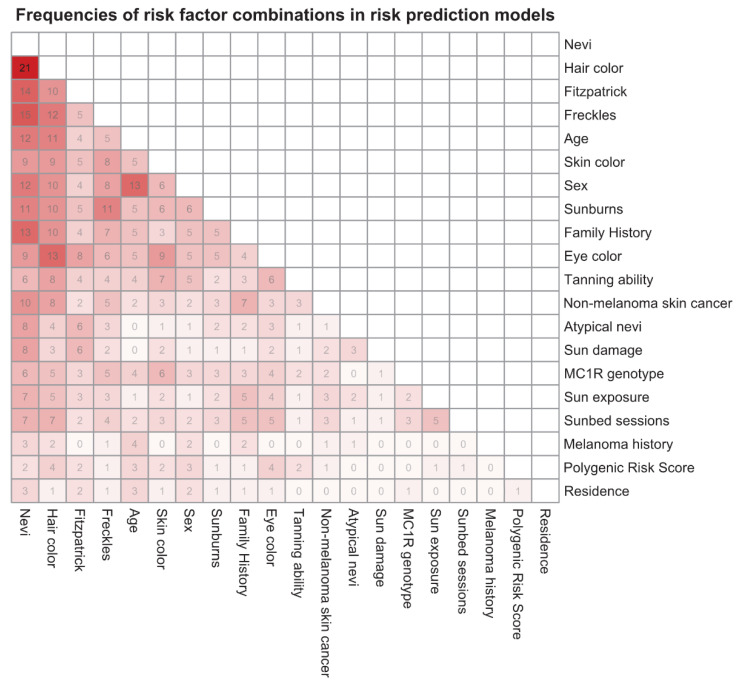
Figure 4.
Heatmap indicating joint occurrences of risk factor pairs in risk prediction models for melanoma. Only risk factors occurring in more than two risk prediction models are included. Each number represents the absolute frequency of the corresponding risk factor combination. The darker the field the more frequent is the corresponding risk factor combination (n = 45 models). MC1R = melanocortin 1 receptor.

