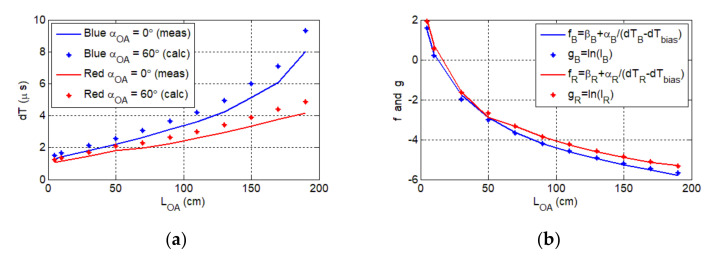
Figure 7.
(a) The delay vs. the optical link length (full line) for the aligned blue and red channels. The calculated axon delay for the maximum misalignment angle (dotted line). (b) The graphical representation of the relation between the photocurrent and the delay , respectively, for the red channel (red line and dots) and the blue channel (blue line and dots).

