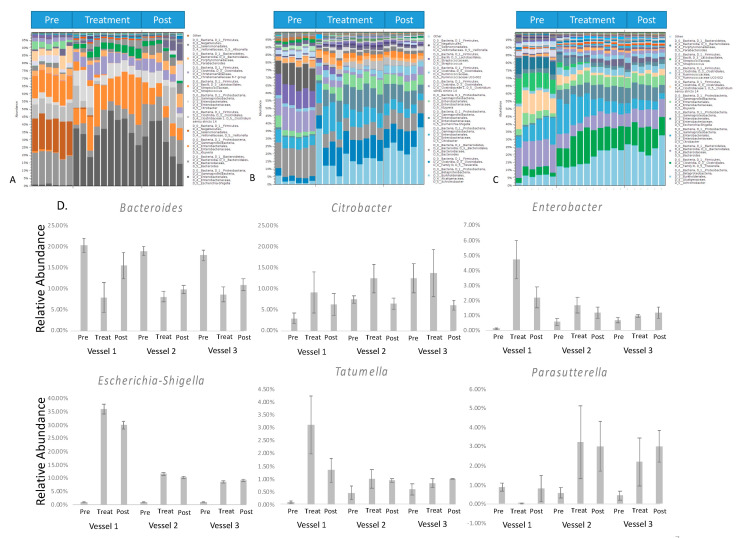
Figure 4.
Bar charts representing bacterial taxonomy based on the 16 S rRNA gene at the genus level in 3 parts of the HCM ((A). Vessel 1; (B). Vessel 2; (C). Vessel 3). (D). The relative abundance of the significant genus in a three-time period. DNA was isolated from vessel contents for MiSeq sequencing. The relative abundance of bacteria was calculated based on the operational taxonomic unit (OTUs). The Y-axis represents the relative abundance of each detected genus.

