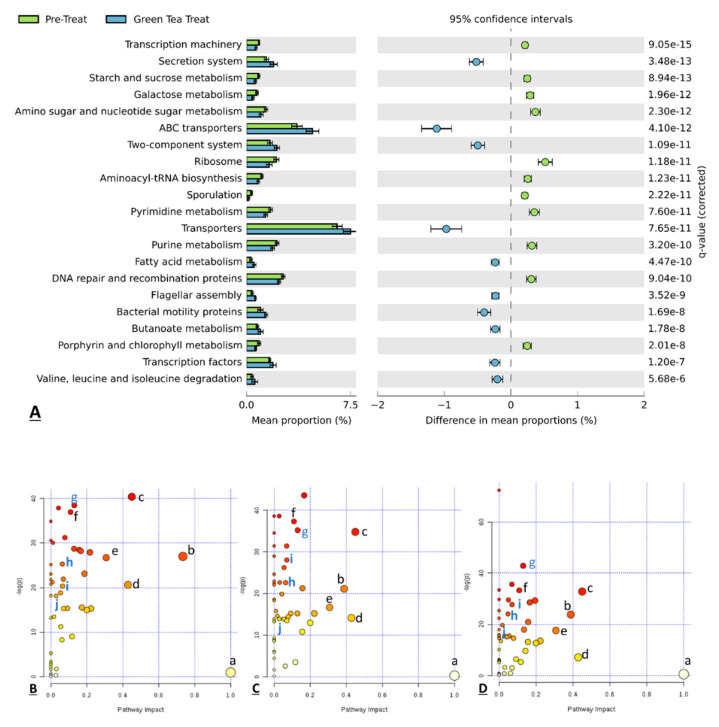
Figure 7.
The difference in the mean proportion of microbial functions between the pretreatment samples and treated samples along with the associated 95% confidence interval of this effect size, q-value below 0.005, and the difference between proportions above 0.2 (A). Representative pathway analysis indicated major pathways in the comparison of pretreatment samples vs. green tea treated samples ((B–D) for vessel 1, vessel 2, and vessel 3). Some common pathways of three vessels that have –log(p) above 10 are labeled in lower case letters as: a. Inositol phosphate metabolism; b. Alanine, aspartate, and glutamate metabolism; c. Glycine, serine, and threonine metabolism; d. Biotin metabolism; e. beta-Alanine metabolism; f. Cysteine and methionine metabolism; g. Aminoacyl-tRNA biosynthesis; h. Pyrimidine metabolism; i. Purine metabolism; j. Butanoate metabolism.

