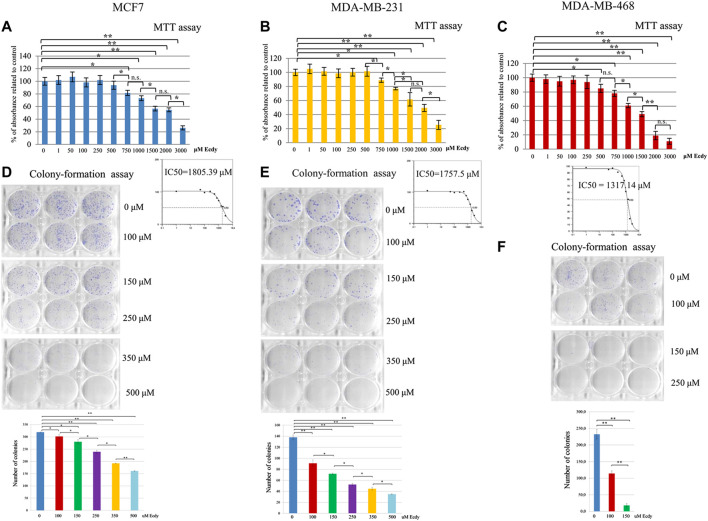
FIGURE 1.
Ecdysterone inhibits breast cancer cell lines. Results of MTT-test for: (A) MCF7, (B) MDA-MB-231, and (C) MDA-MB-468 cells treated with increasing concentrations (0–3,000 µM) of Ecdy for 48 h. Results are depicted as the mean ± SD. *p < 0.05; **p < 0.01; n.s. – not significant. Corresponding IC50 plots are displayed below the MTT diagrams. IC50 was calculated using AAT Bioquest IC50 online calculator https://www.aatbio.com/tools/ic50-calculator. Results of the colony-formation assay for (D) MCF7, (E) MDA-MB-231, and (F) MDA-MB-468 treated with indicated concentration of Ecdy. Photographs of plates and quantification diagrams are shown. Results are displayed as the mean ± SEM of three experiments. *p < 0.05; **p < 0.01.

