FIGURE 4.
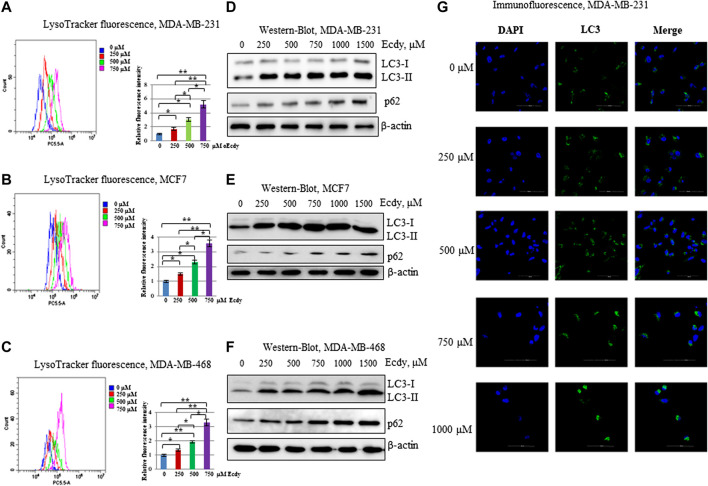
Ecdysterone induces autophagy. (A) MDA-MB-231, (B) MCF7, (C) MDA-MB-468 cells were treated with 0, 250, 500, 750 µM Ecdy for 48 h followed by LysoTracker staining and flow cytometry analysis. The fluorescence of LysoTracker reflects the amount of lysosomes. Flow cytometry plots with median fluorescence and diagrams with fluorescence intensity related to DMSO-treated cells (0 µM Ecdy) are depicted. Results are calculated as the mean ± SEM of three experiments. *p < 0.05; **p < 0.01. (D) MDA-MB-231, (E) MCF7, (F) MDA-MB-468 cell lines were treated with 0, 250, 500, 750, 1,000, and 1,500 µM Ecdy for 32 h and then co-treated with the same concentrations of Ecdy and 50 µM chloroquine to block autophagy for 16 h followed by western-blot analysis for LC3 and p62 reflecting autophagy flux. (G) MDA-MB-231 cells treated as above were stained with DAPI and anti-LC3 antibodies and analyzed by immunofluorescence microscopy.

