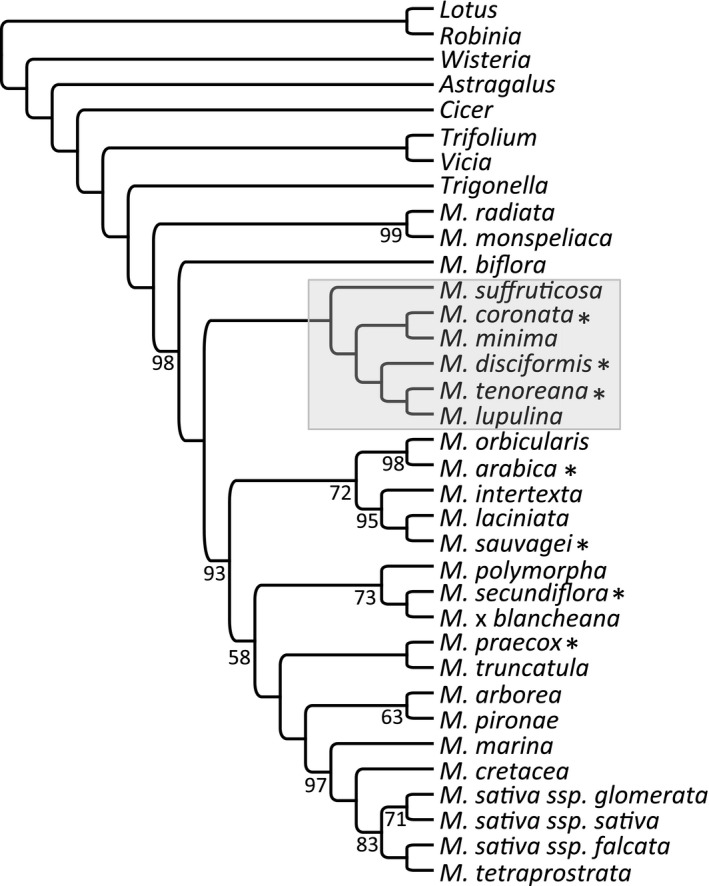
Figure 1.

Relationships among 27 Medicago. The cladogram depicting relationships of Medicago (M) and outgroups was based on maximum likelihood phylogenetic inference using 69 protein‐coding genes shared across all taxa. Bootstrap values less than 100 are shown at the nodes. Newly sequenced plastomes are indicated by asterisks, and the M. minima clade is boxed in gray. ssp., subspecies
