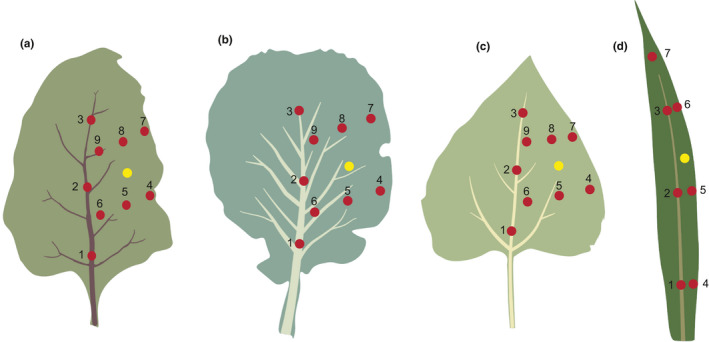
Figure 1.

Schematic illustration of selection of points on a leaf for leaf trait measurements for the different plant species. (a) Beetroot, (b) cabbage, (c) sunflower, (d) corn. Points 1, 2, and 3 covered the main vein, whereas other points were positioned on soft tissue. We did not consider whether a point on soft tissue covered a smaller vein or capillary. The yellow point represents the source of stimulation for the transmission experiment. Due to the very different shape of corn leaves (d), the point amount and distribution was different
