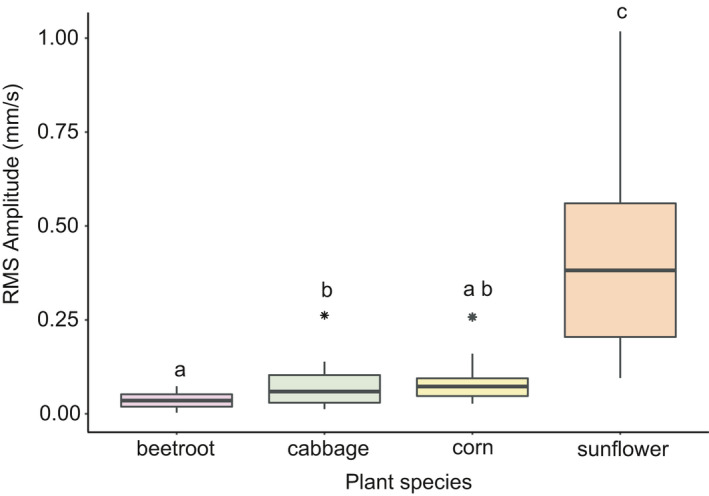
Figure 4.

Boxplots showing the variation in RMS amplitude (mm/s) of chewing vibrations on the different plant species. The letters indicate significant pairwise differences (p < .05) calculated by a Tukey HSD post hoc test. The interquartile range was taken as the range from 0 to 25th percentile. From the mean, the whiskers show the highest and the lowest value within 1.5 times the interquartile range
