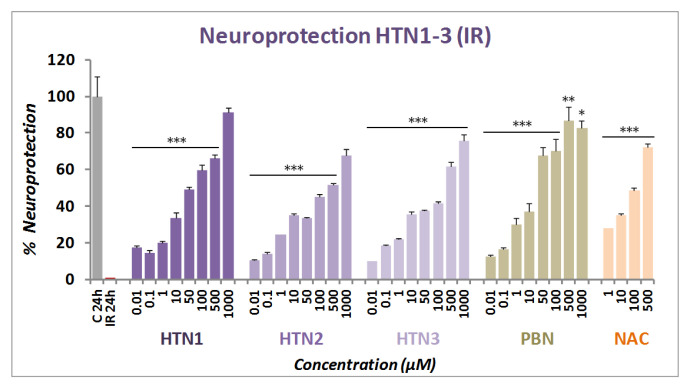
Figure 3.
Neuroprotective effect of HTNs 1-3 on neuroblastoma cell viability after oxygen glucose deprivation (4 h) and ischemic reperfusion (24 h) (IR). Bars show % neuroprotection at indicated concentrations, considering 100% neuroprotection the difference in viability between Control (C24h) and IR alone. Values represent the mean ± SEM after three experiments, each one in triplicate. The statistics compare the effect of each HTN concentration with 100% neuroprotection, without IR (C 24h) at * p < 0.05, ** p < 0.01, and *** p < 0.001 (ANOVA one-way, followed by Holm−Sidak analysis as test post hoc).

