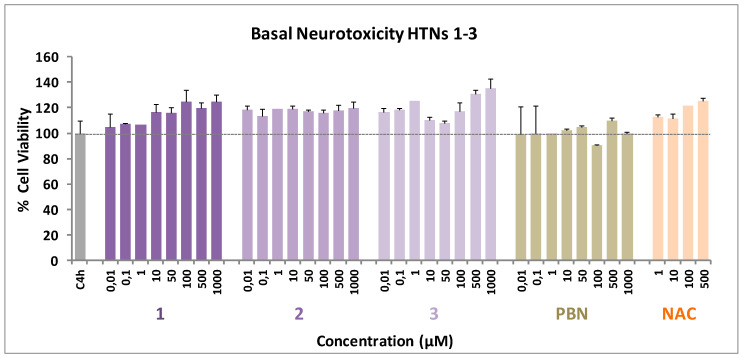
Figure 6.
Effect of HTNs 1-3, PBN, and NAC on human neuroblastoma SH-SY5Y cell viability under basal conditions. Bars represent % of cell viability in the presence of the ligands at the indicated concentrations. Cell viability for the untreated cells (C4h) was assigned 100% (100 ± 5.52%). Values are the mean ± SEM of five experiments, each one in triplicate. No statistically significant differences were observed between the control (black dotted line) and the different nitrones tested at the concentrations indicated (one-way ANOVA test).

