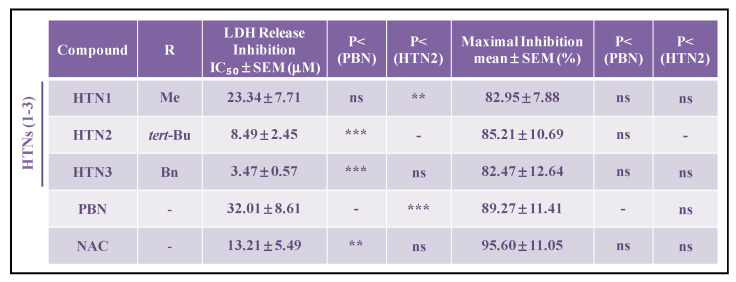
Table 3.
Effect of HTNs 1-3, PBN, and NAC on the lactate dehydrogenase release after oxygen glucose deprivation/ischemic reperfusion in human neuroblastoma SH-SY5Y cells. EC50 and maximal activities.

|
The estimation of IC50 (μM) and maximal inhibitory activities (%) values were performed by a weighted nonlinear regression of minimum squares using logistic curves, as is described in the “Statistical Analysis” section of “Neuroprotection Assessment Assays”. Values are the mean ± S.E.M. Data analysis was carried out with SigmaPlot v.12., and ANOVA one-way to get the significant statistics of HTNs with respect to PBN, or to HTN2. Differences are statistically significant when p < 0.05, ** p < 0.01, ** p < 0.001. ns = non-significant (ANOVA one-way, followed by Holm−Sidak analysis as test post hoc).
