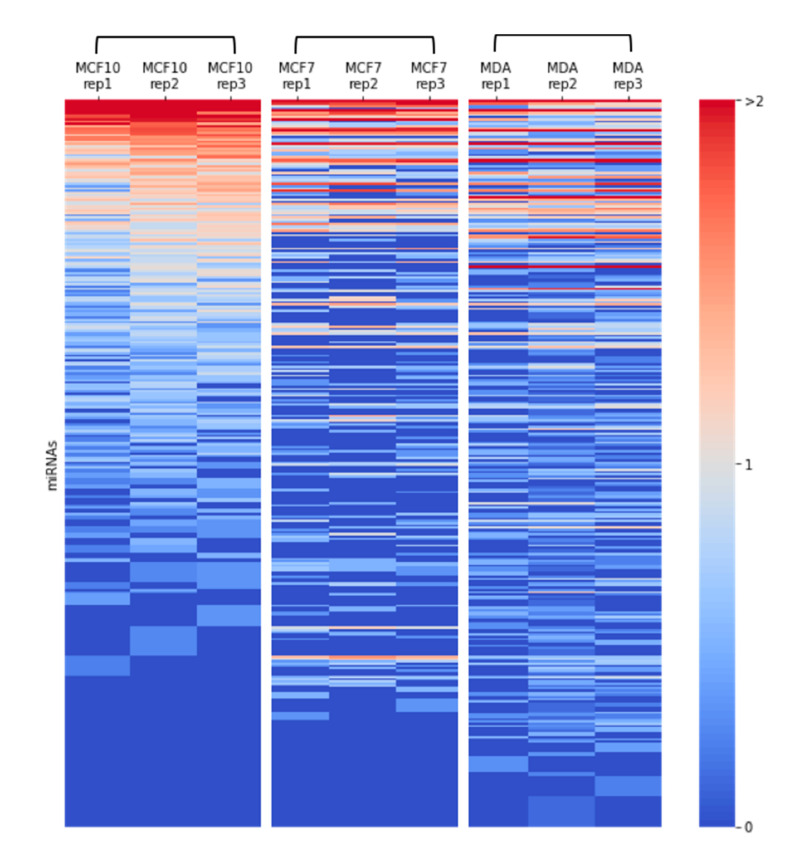
Figure 2.
Heatmap of miRNA expression in breast cancer cells. Expression of SF-miRNAs in triplicates from each of the breast cancer cell-lines: MCF-10A, MCF-7, and MDA-MB-231, are presented. Color code represents the amount of reads in a logarithmic scale (log10). All miRNAs that are analyzed have ≥10 reads in any specific cell type, a minimal read length of ≥17. The data source is in Supplemental Table S2.

