Figure 5.
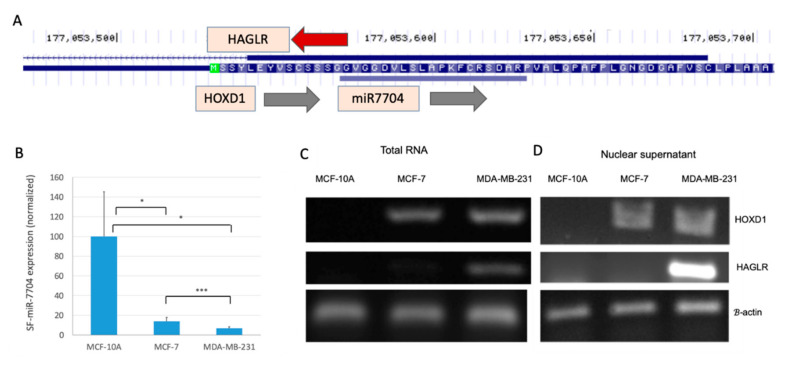
Inverse correlation between the expression of miR-7704 and HAGLR. (A) UCSC Genome browser view for miR-7704 indicates the overlap with HOXD1 and the lncRNA HAGLR. (B) Average expression levels and standard error of the mean (SEM) of miR-7704 from the SF from MCF-10A, MCF-7 and MDA-MB-231 cells. Pair statistics are marked for <0.1 (*) and <0.001 (***). Comparison of the results of RT-PCR assays of HOXD1 and HAGLR expression as measured from total RNA (C) and nuclear RNA (D) in the three tested breast cell-lines. Results shown are representative RT-PCR. The identity of the extracted bands was confirmed by DNA sequencing.

