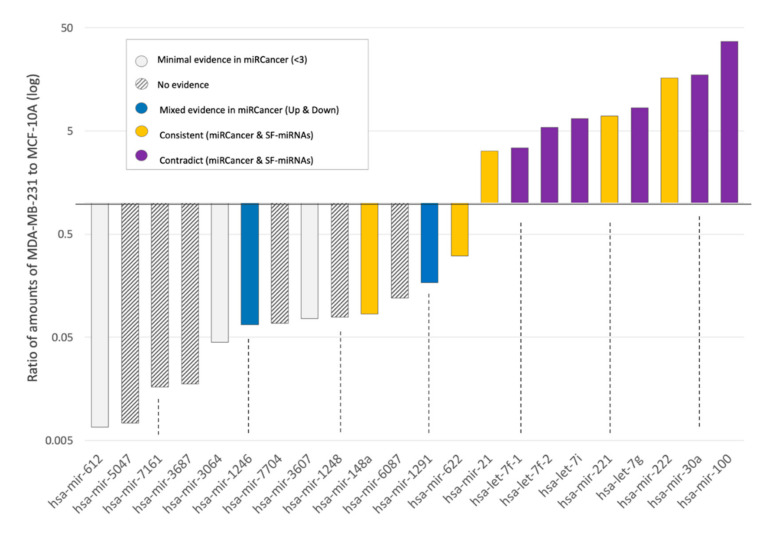
Figure 8.
Expression level of SF-miRNAs in breast cancer cell-lines with respect to miRCancer annotations. Ratio of expression of SF-miRNAs in MDA-MB-231 to MCF-10A (log scale). A total of 22 differentially expressed SF-miRNAs are listed with a minimal expression levels of >50 reads (sum of MCF-10A and MDA-MB-231 expression reads). The color signifies the comparison according to the consistency with miRCancer (yellow—consistent trend; grey stripes—not available; blue, mixed trend; purple, opposite trend; white, minimal support (defined as miRNA with only 1–2 reported publications).

