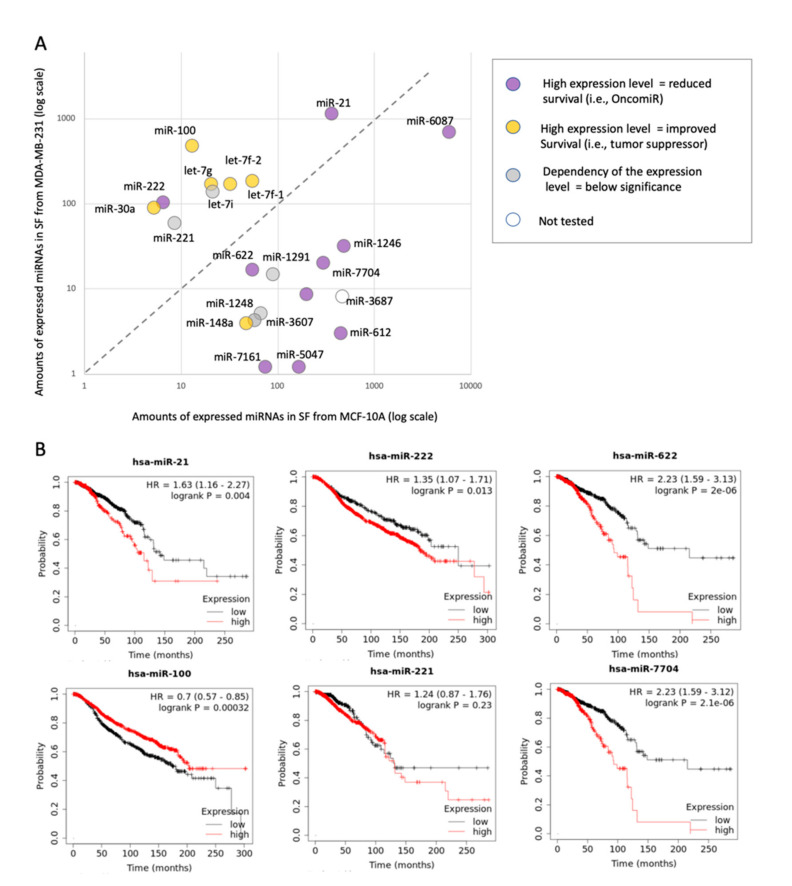
Figure 9.
Expression of SF-miRNAs in different cell-lines vis-à-vis the patient’s overall survival rate. (A) Scatter plot of the SF-miRNAs expression in non-cancerous MCF-10A cells (x-axis) and metastatic MDA-MB-231 cells (y-axis) is presented. A total of 22 differentially expressed SF-miRNAs are listed with a minimal expression levels of >50 reads (sum of MCF-10A and MDA-MB-231 expression reads). The results of the Kaplan–Meier (KM) survival plots are color coded with miRNAs that are oncogenic (purple), protective (yellow), and statistically insignificant (grey). Each tested miRNA is colored by the survival rate from breast cancer patients extracted from the TCGA (1062 samples) and METABRIC (1262 samples) projects. The KM survival plots analyze the survival (in months) associated with high and low expression quartiles of the selected miRNAs. Analysis is completed for 21 of the 22 SF-miRNAs (see Supplemental Table S6). (B) Representative SF-miRNAs analyzed by KM survival plots with respect to the calculated hazard ratio (HR, 95% confidence intervals) and logrank with a p-value < 0.05.

