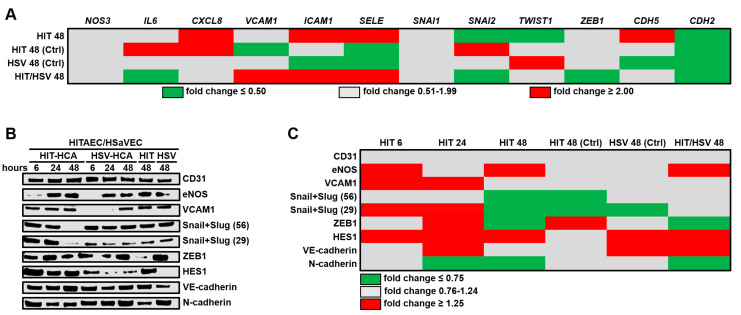
Figure 2.
Profiling of key endothelial molecules in HITAECs (HIT) and HSaVECs (HSV) co-cultured with HCAECs for 6, 24, or 48 h. (A) RT-qPCR profiling, HIT signifies the ratio of transcript levels (measured as ΔCt) in HITAECs to those in HSaVECs co-cultured with HCAECs. HIT (Ctrl) and HSV (Ctrl) represent the ratios of transcript levels (measured as ΔCt) in HITAECs and HSaVECs co-cultured with HCAECs to those in the respective monocultures. HIT/HSV signifies the ratio of transcript levels (measured as ΔCt) in HITAEC to those in HSaVEC monocultures. Results are represented as the heat map; green, gray, and red colours indicate fold changes of ≤0.50, 0.51–1.99, and ≥2.00, respectively; (B) Western blotting measurements. HIT-HCA signifies HITAECs co-cultured with HCAECs, HSV-HCA abbreviates HSaVECs co-cultured with HCAECs. HIT and HSV represent HITAEC and HSaVEC monocultures, respectively. (C) Semi-quantitative analysis of Western blotting results by densitometry. HIT signifies the ratio of band density in HITAECs to that in HSaVECs co-cultured with HCAECs. HIT (Ctrl) and HSV (Ctrl) signify the ratios of band density in HITAECs and HSaVECs co-cultured with HCAECs to those in the respective monocultures. HIT/HSV signifies the ratio of band density in HITAEC monoculture to that in HSaVEC monoculture. Snail + Slug are shown at both 56 and 29 kDa values. Results are represented as green, gray, and red colours on the heat map, indicating fold changes of ≤0.75, 0.76–1.24, and ≥1.25, respectively.

