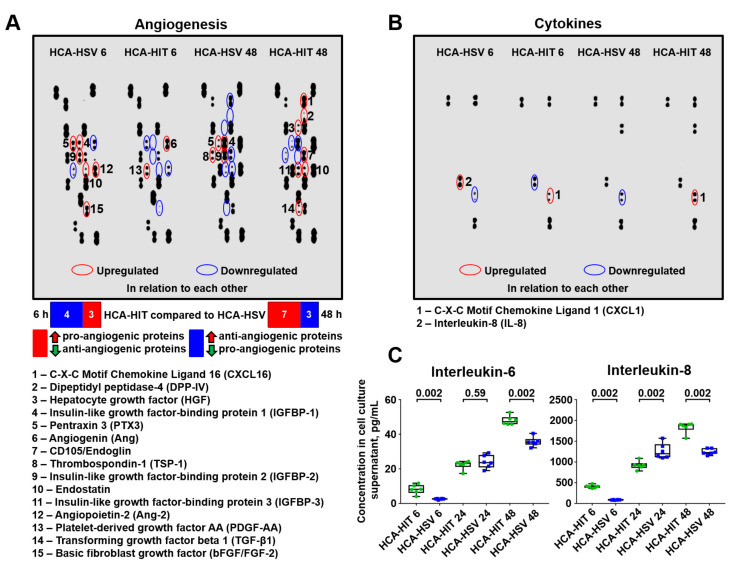
Figure 3.
Secretome profiling in the supernatants from HCAEC–HITAEC and HCAEC–HSaVEC co-culture models collected at 6- and 48-h time points. (A) Measurement of 55 human angiogenesis-related proteins. (B) Measurement of 36 cytokines, chemokines, and acute phase proteins. Those upregulated or downregulated in the HCAEC–HITAEC (HCA-HIT) co-culture model in comparison with the HCAEC–HSaVEC (HCA-HSV) model are circled in red and blue, respectively. (C) High-sensitivity enzyme-linked immunosorbent assay measurements of interleukin-6 and interleukin-8. For this experiment, we also included a 24-h time point. Each dot represents one aliquot from the co-culture model. Whiskers indicate range, boxes’ bounds indicate 25th–75th percentiles, center lines indicate median. P values provided above boxes, Mann–Whitney U-test.

