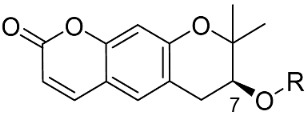
Table 1.
Effect of R substituents on BTK inhibition.

| Compound No. | R | % Inhibition (10 µM) a | IC50 (µM) b | |
|---|---|---|---|---|
| BTK-wt | BTK-C481S | |||
| 1 |

|
32.0 | >10 µM | |
| 2 | H | 7.7 | >10 µM | |
| 3 |

|
11.3 | >10 µM | |
| 4 |

|
20.3 | >10 µM | |
| 5 |

|
NA c | >10 µM | |
| 6 |

|
NA | >10 µM | |
| 7 |

|
34.5 | 7.0 | |
| 8 |

|
98.2 | 9.7 | 0.8 |
| 9 |

|
95.8 | 15.8 | 0.9 |
| 10 |

|
99.2 | 18.6 | 0.5 |
| 11 |

|
NA | >10 µM | |
| 12 |

|
NA | >10 µM | |
| Ibrutinib d | - | 99.6 | 0.00018 | |
a Percentage BTK inhibition was determined and compared with that of the negative control (DMSO) at 10 µM. The values represent the mean values of two separate experiments. b The IC50 values were calculated using GraphPad Prism version 5.0. c NA indicates not active at 10 µM. d Ibrutinib as a positive control.
