Figure 5.
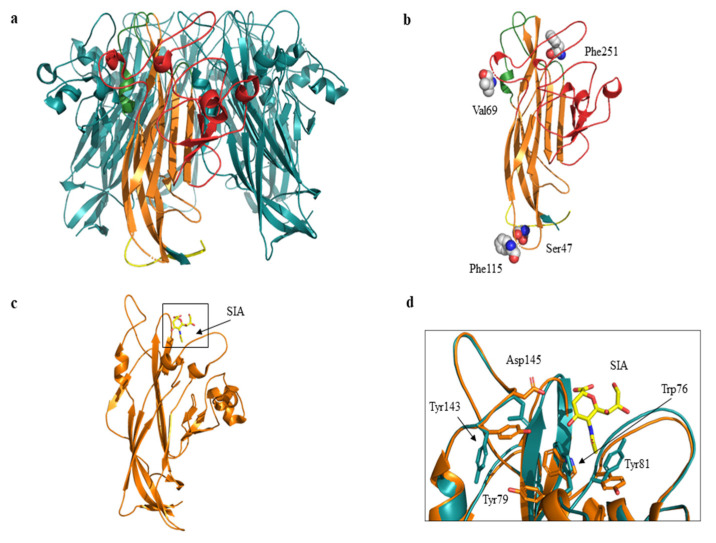
Cartoon and three-dimensional model of MCPyV VP1 pentamer and monomer. (a) VP1 pentamer. The monomer is highlighted in yellow (N-term region), in orange (β sandwich core), in green (apical or membrane binding loops) and in red (side or neutralizing epitope loops). The C-term region is not shown. (b) Three-dimensional model of VP1 monomer. Residues corresponding to the mutated sites are displayed as spheres and labelled. 7 P revealed Val69 and Phe251 substitutions, 7 U and 17 U revealed Ser47 and Phe115 substitutions respectively. (c) VP1 monomer shown as cartoon representation. The sialic acid (SIA) binding site is highlighted in the black box. SIA is displayed in yellow sticks. (d) Superposition between wild-type (orange) and ModRefiner monomer (cyan) models. Residues located in proximity of sialic acid (SIA) are displayed as sticks and labelled. Tyr79 corresponds to the mutated site.

