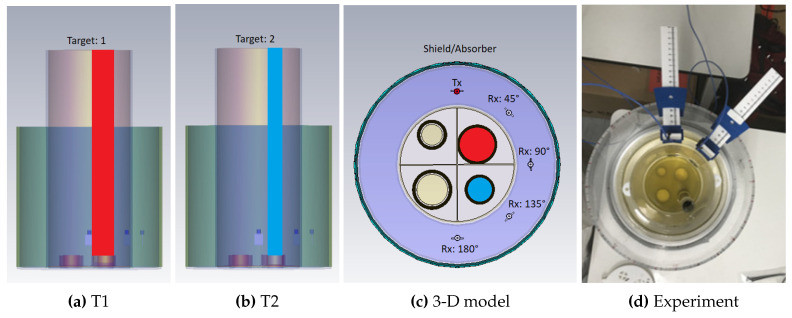
Figure 1.
The modelled 3-D simulated and experimental configuration used to observe the transmitted signal differences caused by different dielectric targets: Drawings of (a) Target T1 (r = 15mm), (b) Target T2 (r = 10mm), and (c) the 3-D model used in simulations; (d) Photo of the experimental setup shown in these drawings.

