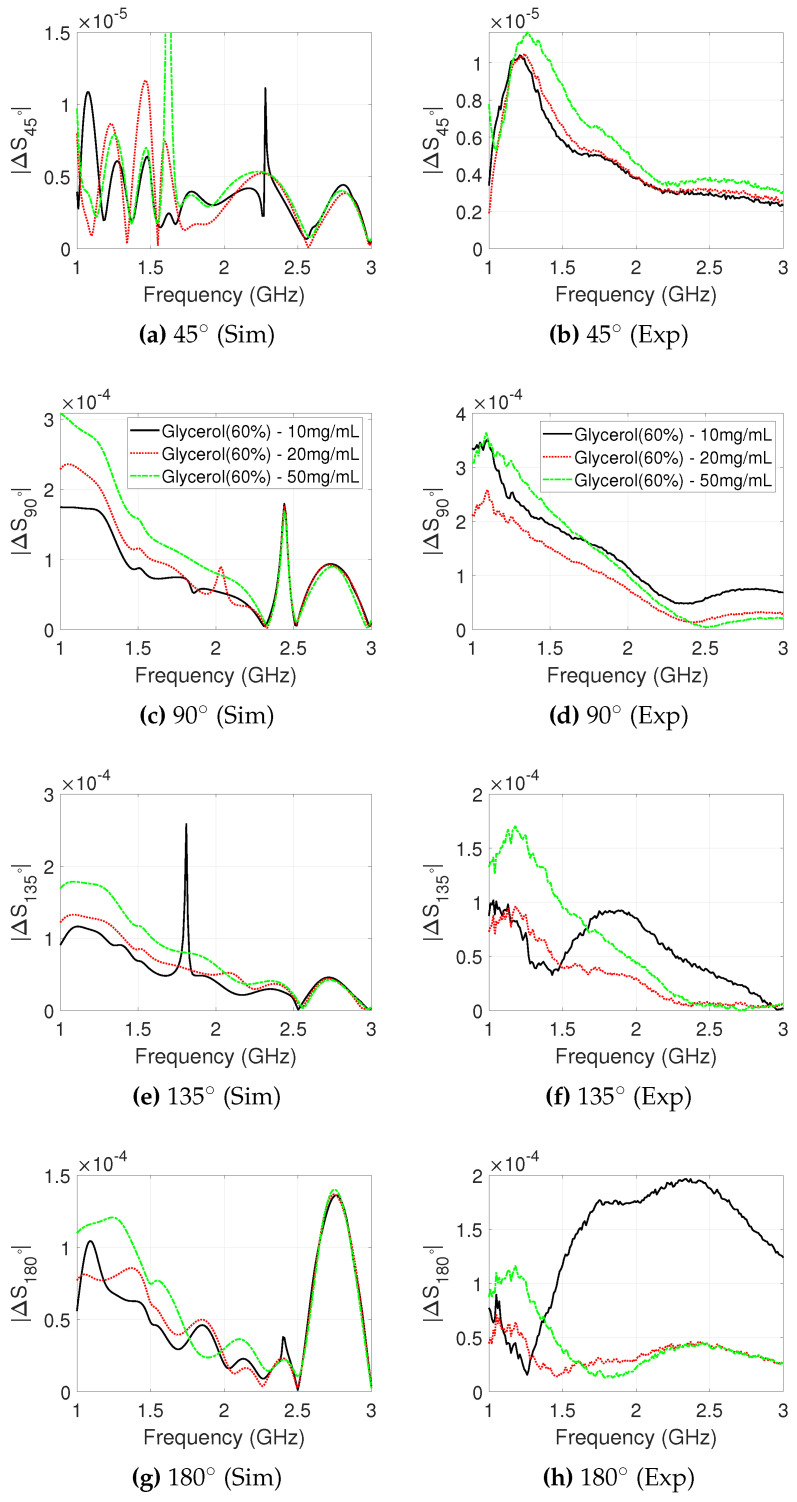
Figure 4.
Difference in received signal strength between “no-target” and “target T1” cases, plotted for each receiver position against frequency. T1 is filled with salt concentrations between 10 and 50mg/mL dissolved in 60% glycerol. The simulated (left) and experimental (right) signal differences are plotted between 1.0 and 3.0 GHz, which is the operational frequency range for the employed antennas.

