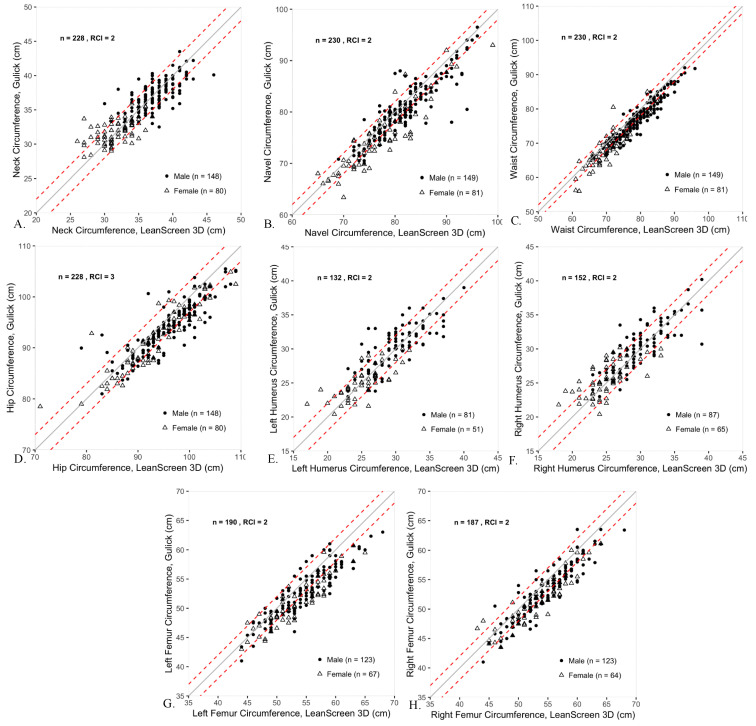
Figure 1.
Scatter plots comparing circumferences at the 8 different anatomical sites as measured by LS3D (x-axis) and Gulick tape (y-axis). The dashed lines represent the RCIs, which are 2 cm for all measures except at the hip (RCI = 3 cm). The solid line is the unity line. Males are represented as filled circles, while females are represented as open triangles.

