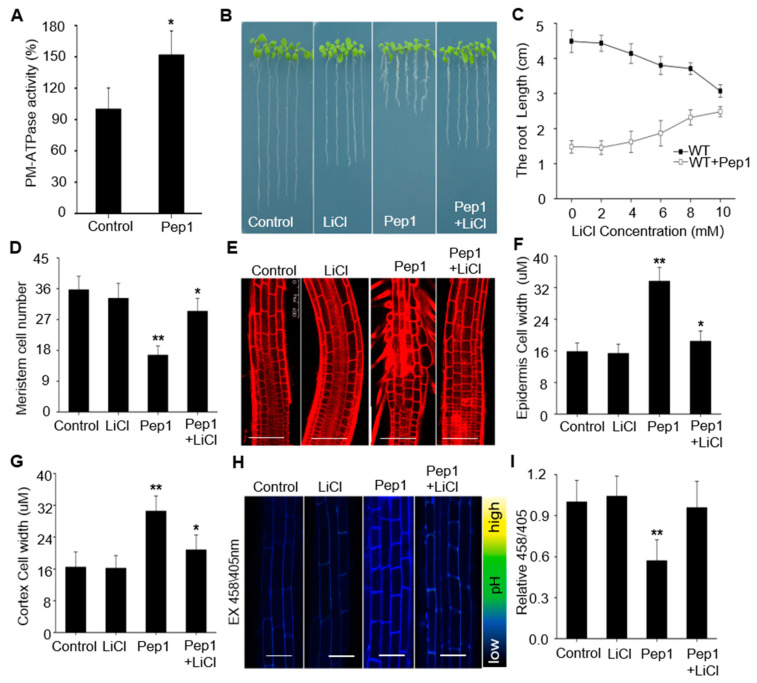
Figure 3.
Pep1 activates the plasma membrane-localized H+-ATPases (PM H+-ATPases) to inhibit root growth. (A) The PM H+-ATPase activity in microsomal membranes isolated from 5-week-old wild-type (WT) roots treated with 100 nM Pep1 for 72 h, the PM H+-ATPase activity in control condition was normalized to 1.0. Data are mean ± SD of three independent experiments. The growth phenotype (B) and the length of primary root (C) of three-day-seedings were transferred on half-strength MS agar medium supplemented with or without (Control) 10 mM LiCl, 100 nM Pep1, or 10 mM LiCl + 100 nM Pep1 for 6 days. (D) Statistics of the number of meristematic cells in root cortex as in (B). Data in (B), (C,D) are means ± SD from three independent experiments (n = 24, n represents the number of samples). (E) The root longitudinal structures in WT seedlings. Five-day-old seedings were transferred on half-strength MS agar medium supplemented with or without (Control) 10 mM LiCl, 100 nM Pep1, or 10 mM LiCl + 100 nM Pep1 for 24 h. the roots were stained with 5 uM PI for 15 s and photographed under a confocal laser-scanning microscope. Bars = 100 um. (F,G) Quantitative analysis of epidermal and cortex cell width in TZ as indicated in (E). Data are means ± SD (n = 32 cells from 8 roots per treatment). (H) HPTS fluorescence signals in 6-day-old WT roots treated with or without (Control) 10 mM LiCl, 100 nM Pep1, or 10 mM LiCl + 100 nM Pep1 for 8 h. The root-apex fluorescent signals represented protonated HPTS (EX405) (Excitation 405 nm, emission peak 514 nm), deprotonated HPTS form (EX458) (Excitation 458 nm, emission peak 514 nm), and the merge of EX458/EX405. Color code (black to yellow) depicts (low to high) 458/405 intensity. Bars = 20 um. (I) The summarized values on fluorescent ratio of deprotonated HPTS to protonated HPTS in the cortex cells of transition zone as indicated in (H). The fluorescent ratio of the control was set to 1.0, and the treatment ratio was normalized to the control ratio. Data are mean ± SD from three independent experiments (n = 16 cells from 8 roots per treatment). Asterisks indicate statistically significant differences compared with Control (Tukey‘s test; * p < 0.05, ** p < 0.01).

