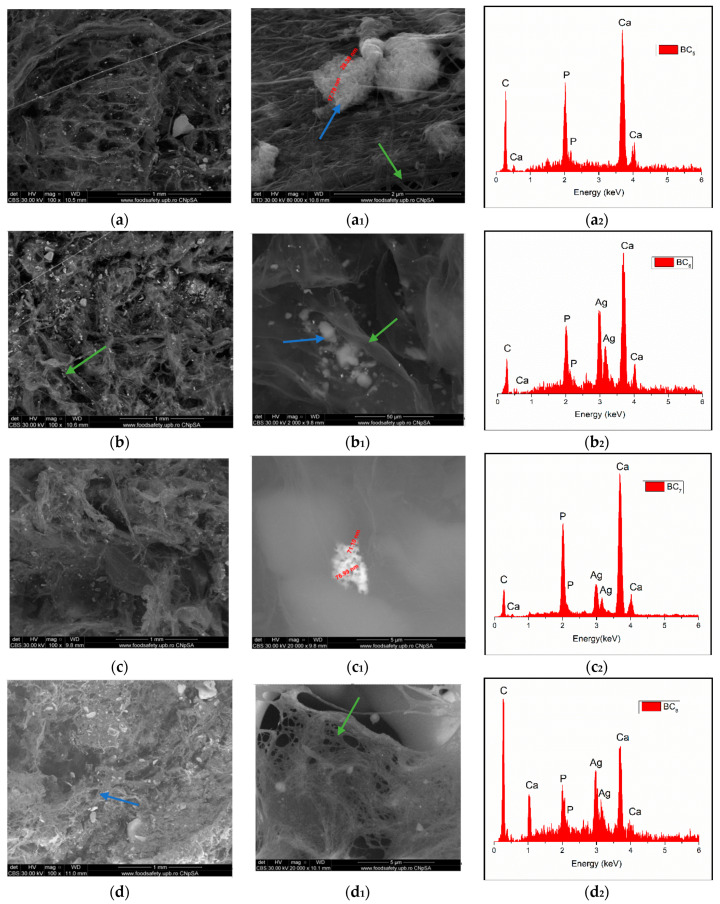
Figure 8.
High-resolution backscattered electron (BSE) images and EDS spectra at 100× magnification for BC5 (a,a1,a2), BC6 (b,b1,b2), BC7 (c,c1,c2), and BC8 (d,d1,d2) (where a1–d1 images represent a high magnification of a–d image area; green arrow indicates the fibrous structure of BC and blue arrow indicate inorganic particles).

