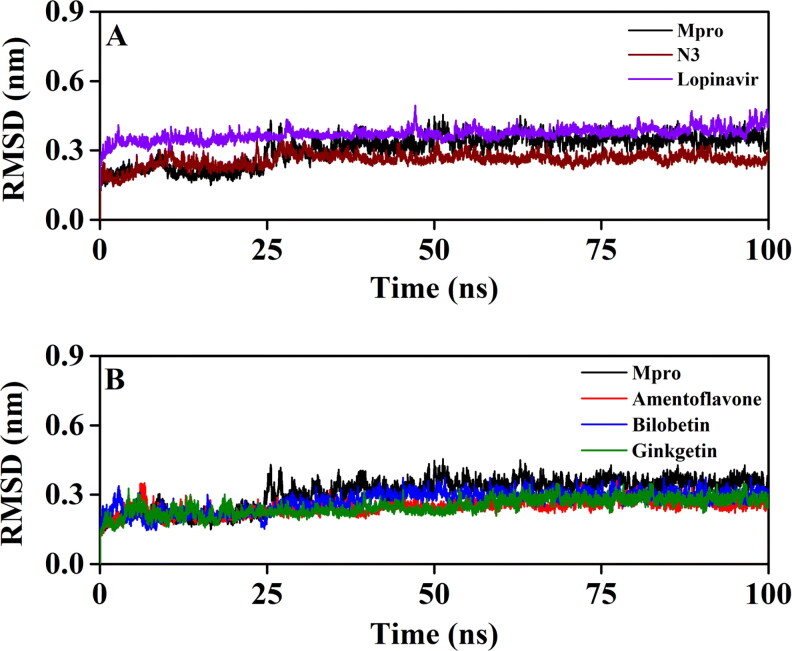
Figure 3.
The RMSD plots of unligated Mpro, Mpro-N3, Mpro-lopinavir and three Mpro-biflavonoid complexes. The RMSD plots of unligated Mpro, Mpro-N3 and Mpro-lopinavir systems are plotted in panel A while panel B represents the RMSD plots of unligated Mpro, Mpro-amentoflavone, Mpro-bilobetin and Mpro-ginkgetin complexes. The MD simulations for each system were performed for 100 ns.

