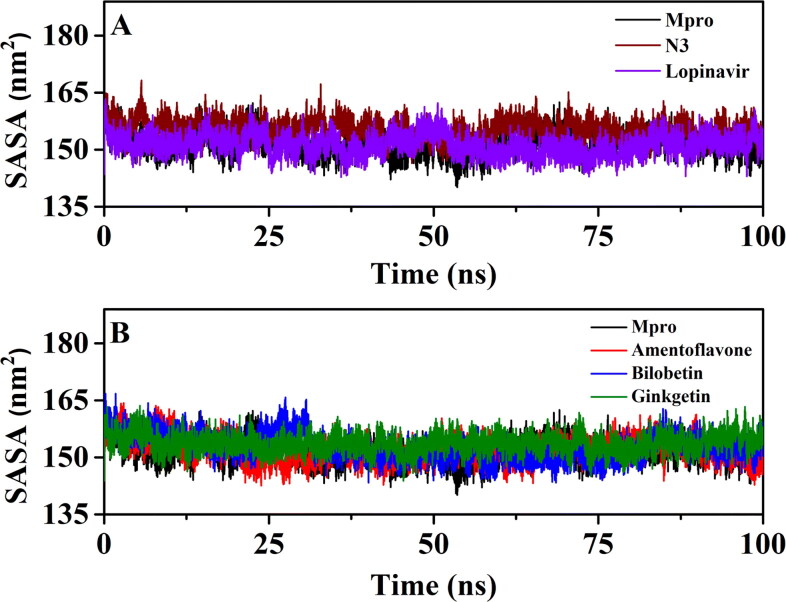
Figure 8.
The SASA plots of unligated Mpro and Mpro complexed with selected standards and T. nucifera biflavonoids. The SASA plots of unligated Mpro, Mpro-N3 and Mpro-lopinavir complexes are plotted in panel A while panel B represents the SASA plots of unligated Mpro, Mpro-amentoflavone, Mpro-bilobetin and Mpro-ginkgetin complexes. The MD simulations for each system were performed for 100 ns.

