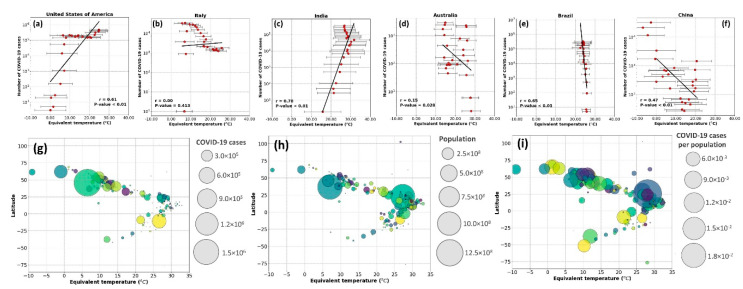
Figure 4.
Top rows: The correlation between the weekly cumulative number of COVID-19 cases and mean weekly equivalent temperature (°C) from January to July 2020 for the (a) USA, (b) Italy, (c) India, (d) Australia, (e) Brazil, and (f) China. Lower row: visualizing the interaction between latitude, equivalent temperature, and (g) the number of COVID-19 cases, (h) population of the area, and (i) the proportion of infected cases normalized based on the population.

