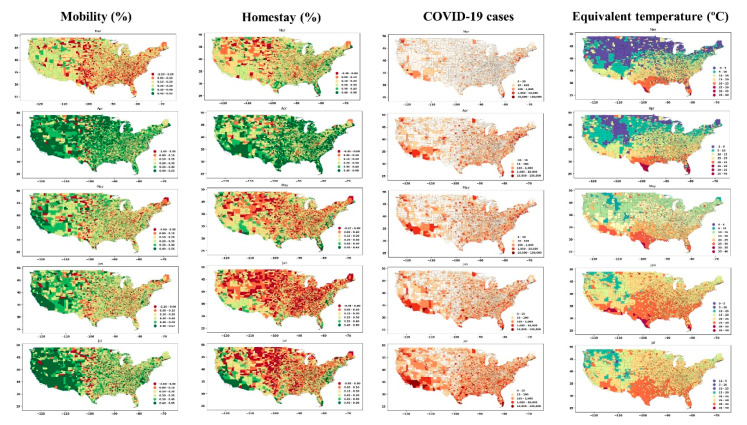
Figure 6.
The spatial distribution of mobility and homestay change (the percent of increase or decrease in 2020 compared to 2019, with green color indicating a reduction in mobility and growth in homestay) and COVID-19 cases (third column) along with the mean equivalent temperature across the USA (rightmost column).

