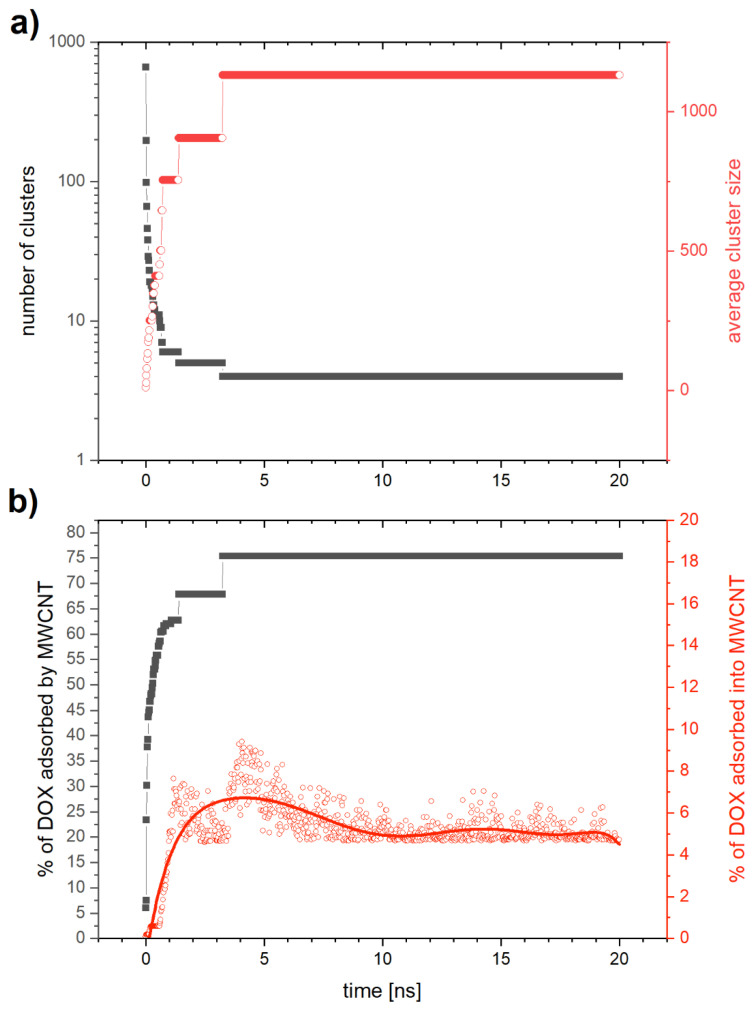
Figure 8.
MD-simulated MWCNTs with DOX: (a) the number of clusters (gray) and mean degree of aggregation of single aggregate (red) as a function of time; (b) fraction of DOX molecules adsorbed on the multiwall carbon nanotube (gray), and that adsorbed inside the multiwall carbon nanotube (red) as a function of time.

