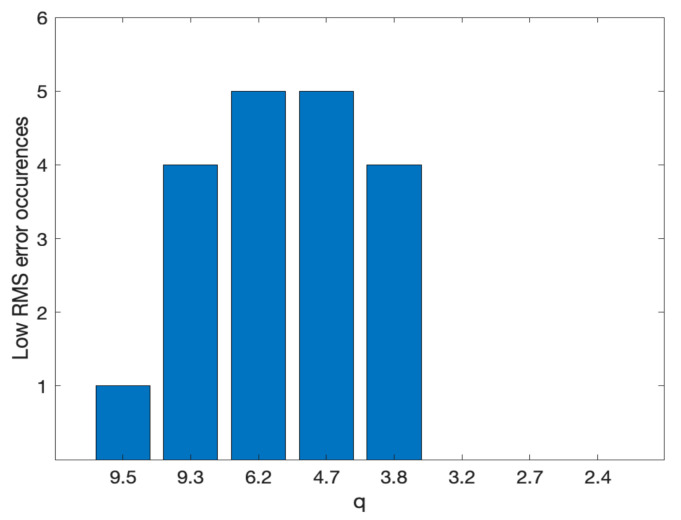
Figure 11.
Histogram of occurrences where the RMS error is within a 10% tolerance from the minimum across the different test object used in the experiments. We can see that the large majority of “low RMS error” conditions corresponds to q = [3.8–9.3], while the range q = [4.7–6.8] identify the range where the point clouds of all five objects exhibit such low RMS error.

