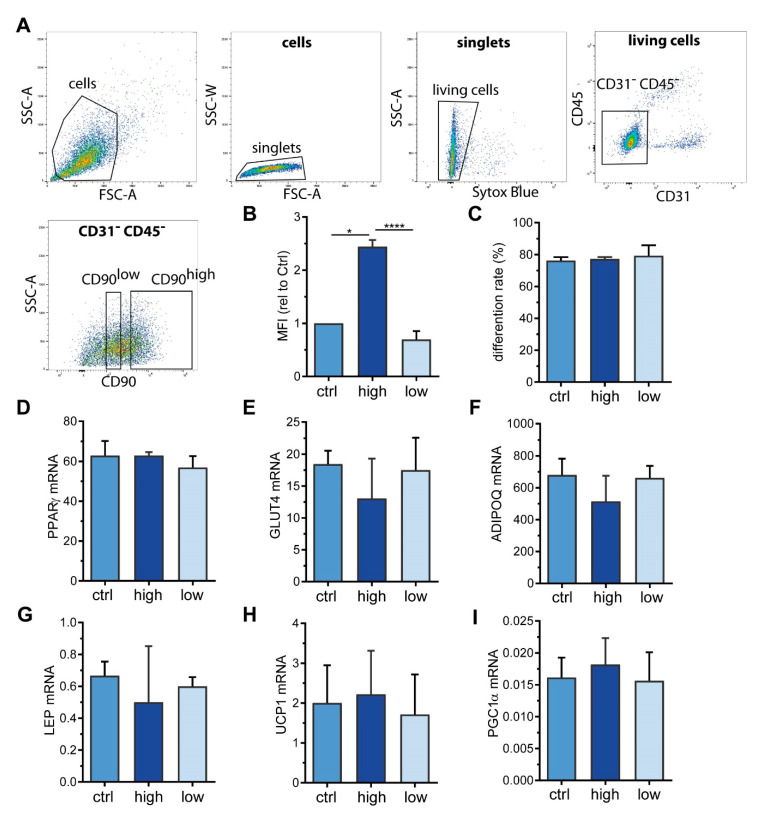
Figure 3.
CD90 surface expression does not impact adipogenic differentiation. ASCs from 3 donors were subjected to fluorescence-activated cell sorting (FACS) using an anti-CD90 antibody to obtain CD90high and CD90low cells. Cells passing through the FACS procedure omitting the anti-CD90 antibody were used as a control (ctrl). (A) FACS gating strategy. SSC-A = side scatter area, SSC-W: side scatter width, FSC-A: forward scatter area. (B) Flow cytometric analysis of CD90 surface expression after sorting procedure. The mean fluorescence intensity (MFI) was normalized to control cells. Data are displayed as mean + SEM. (C–I) CD90high, CD90low, and control cells were subjected to adipogenic differentiation. (C) After 14 days, the rate of adipogenic differentiation was determined microscopically. (D–I) The mRNA expression of (D) PPARγ, (E) GLUT4, (F) adiponectin (ADIPOQ), (G) leptin (LEP), (H) UCP1, and (I) PGC1α was determined by RT-qPCR. TF2B expression was used to normalize the data. Data are displayed as mean + SEM. * p < 0.05, **** p < 0.0001, one-way ANOVA with Tukey correction.

