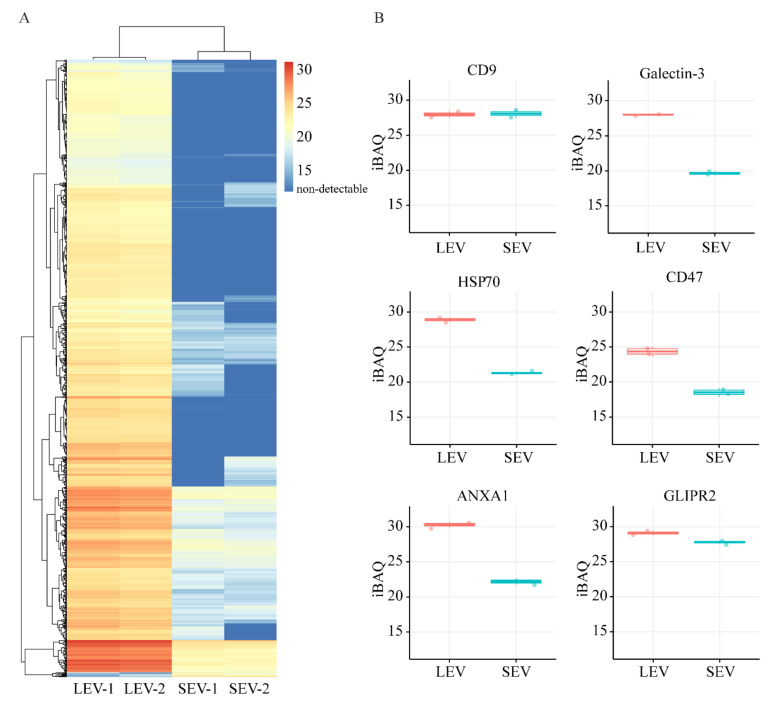
Figure 3.
(A) IBAQ heatmap for all 1557 proteins that were detected either in LEV and/or SEV in both experiments (see Figure 1A). Color code key on the right indicates iBAQ values. Red color is corresponding to relatively high abundance of proteins, darkest blue indicates absence of protein. (B) IBAQ values of six selected proteins in LEV and SEV that were also compared by immunoblotting (see Figure S3B).

