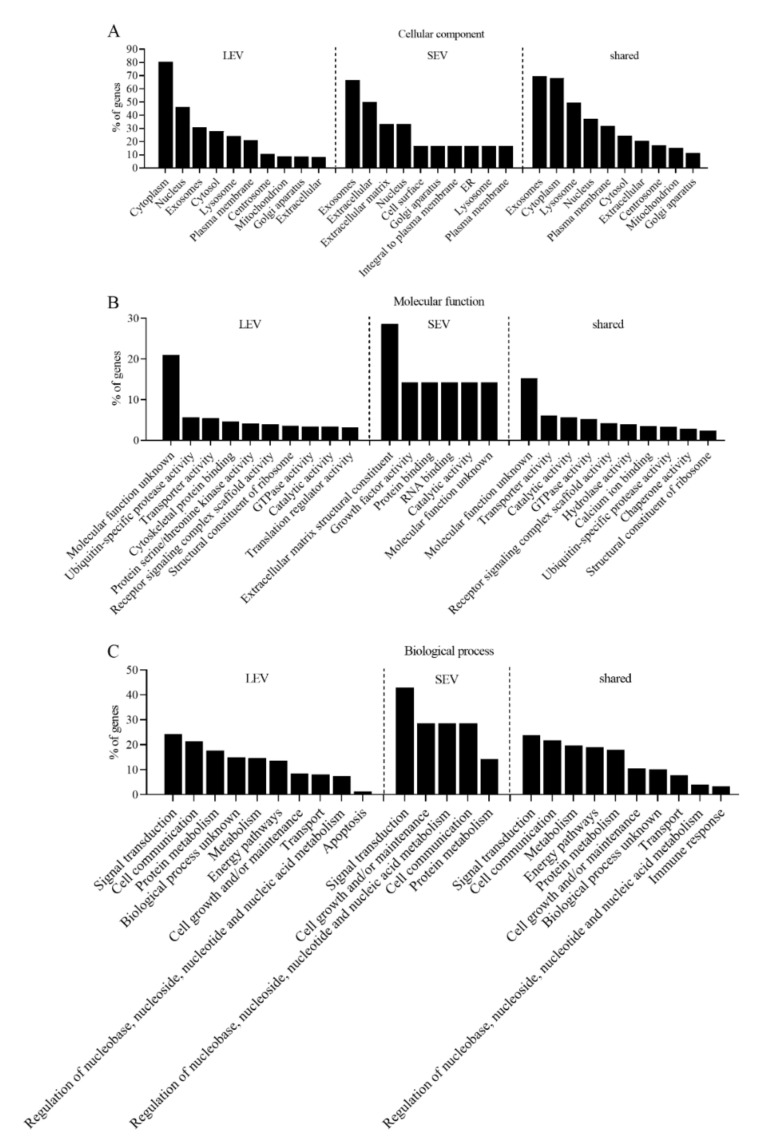
Figure 4.
Gene ontology (GO) annotations of proteins detected in both experiments in LEV only (539 proteins), SEV only (seven proteins), or shared by LEV and SEV (684 proteins). Ranking is according to the database in FunRich and ordered by the percentage of genes per GO term. (A) Cellular component annotations. (B) Molecular function annotations. (C) Biological process annotations.

