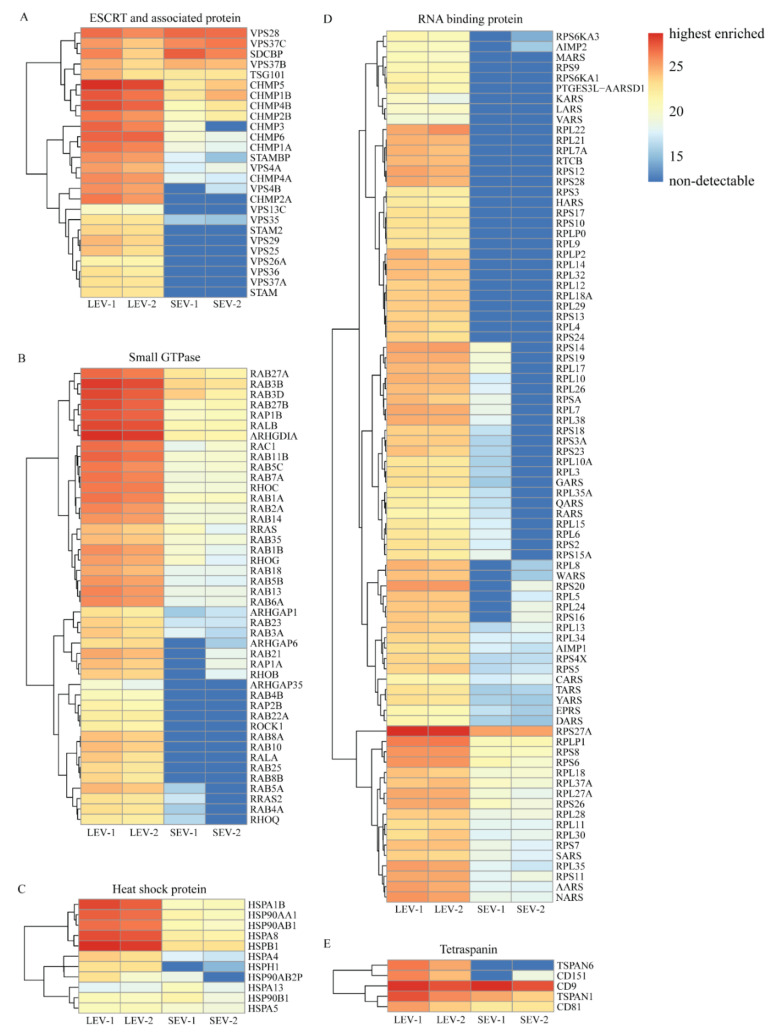
Figure 5.
IBAQ heatmaps for specific protein groups potentially related to EV biogenesis. (A) ESCRT and associated proteins. (B) Small GTPases. (C) Heat shock proteins. (D) RNA binding proteins. (E) Tetraspanin proteins. Color code key on the right indicates iBAQ values. Red color is corresponding to relatively high abundance of proteins, darkest blue indicates absence of protein.

