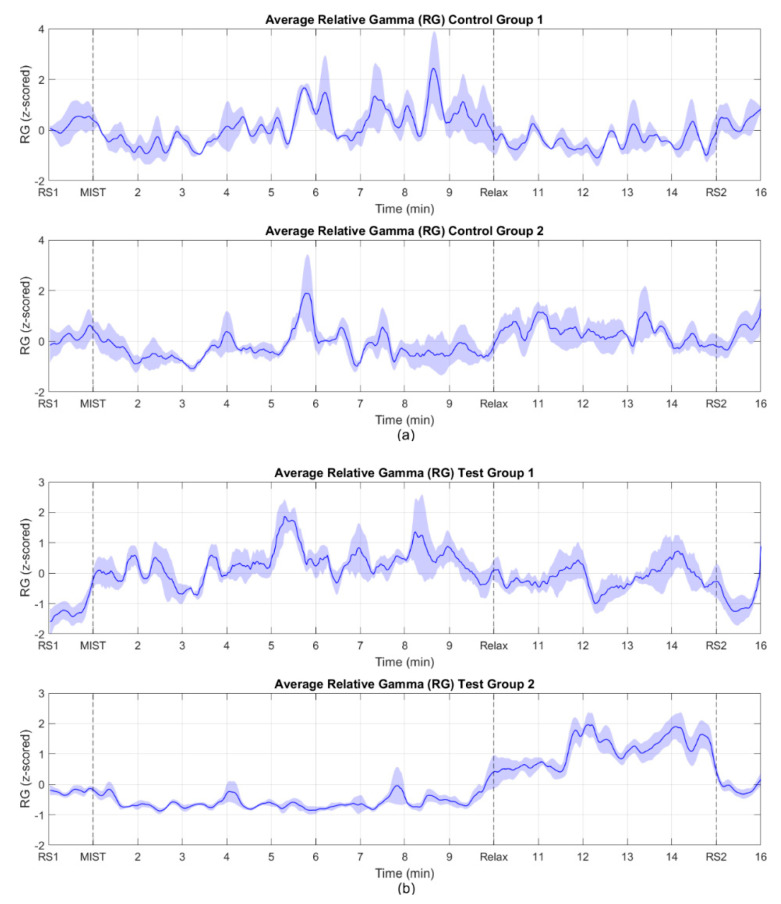
Figure 3.
Time evolution of the average relative gamma in the regions of interest. Group 1 (upper) corresponds to the subjects whose response was directly proportional to the stress level experienced. In Group 2 (bottom), the biomarker response was inversely proportional to their stress level. RS1 and RS2 match the central minute of the resting state blocks. MIST indicates the beginning of the stress session (3 min of training and 6 min of task). Relax indicates the beginning of the relaxing session (5 min). The shaded areas represent the standard error of the mean (SEM). (a) control group. (b) test group.

