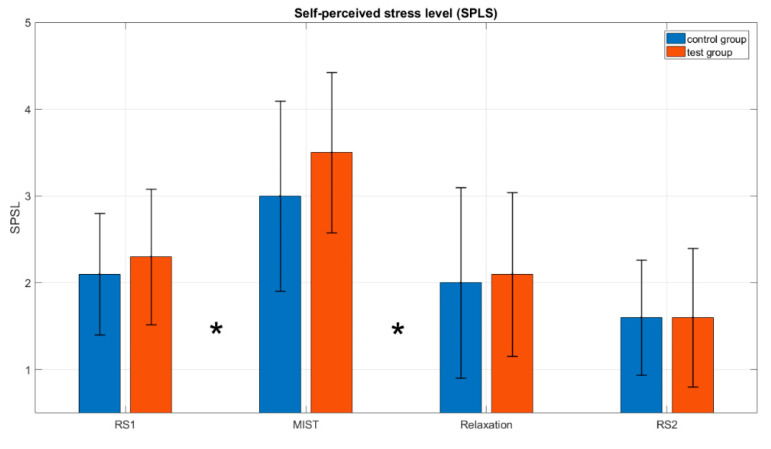
Figure 7.
Average SPSL across participants obtained from surveys at the four moments of interest T1: before Resting State 1 (RS1); T2: just after the MIST; T3: 90 s after the beginning of the relaxation phase and T4: before Resting State 2 (RS2). Black lines represent the standard deviation of the mean. Asterisks (*) indicate, for both groups, a statistically significant difference between the SPSL at RS1 compared to the MIST, and the SPSL at the MIST in comparison to the relaxation phase (Wilcoxon signed rank test, p-value < 0.05). When comparing the SPSL at the same phase for the two groups, no significant differences were found for any of the phases (α = 0.05).

