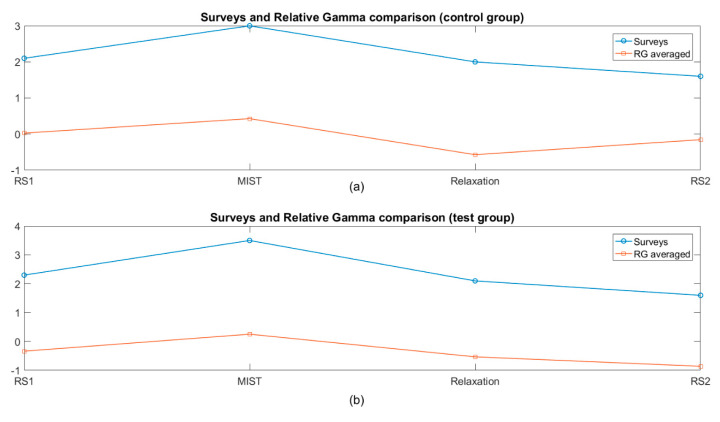
Figure 8.
Average SPSL and relative gamma across participants at four moments of interest (T1, T2, T3, and T4). Relative gamma at the four instants was obtained as the average of the RG values of a minute centered in each moment. The labels RS1, MIST, Relaxation and RS2 correspond to the phases of the experiment where the surveys T1 to T4 were conducted. Units were not included in the vertical axis due to the different magnitudes of the curves. (a) the control group and (b) the test group.

