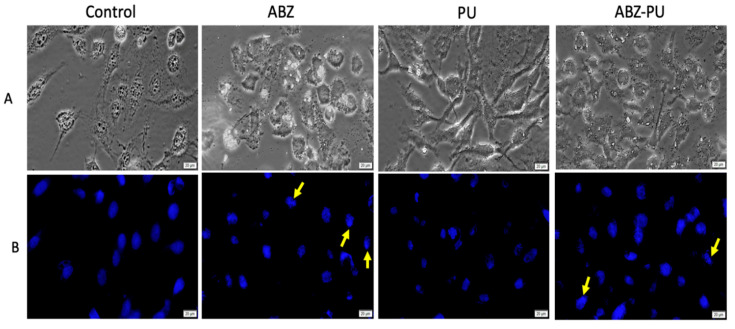
Figure 12.
MDA-MB-231 cells stimulated with the highest concentration (100 µM) of test samples (ABZ, PU, ABZ-PU) for 24 h. (A)—Bright field microscopy was used to observe the cell morphology; (B)—Hoechst staining was employed to assess the specific apoptotic markers (chromatin condensation/DNA fragmentation). Scale bars represent 20 µm.

