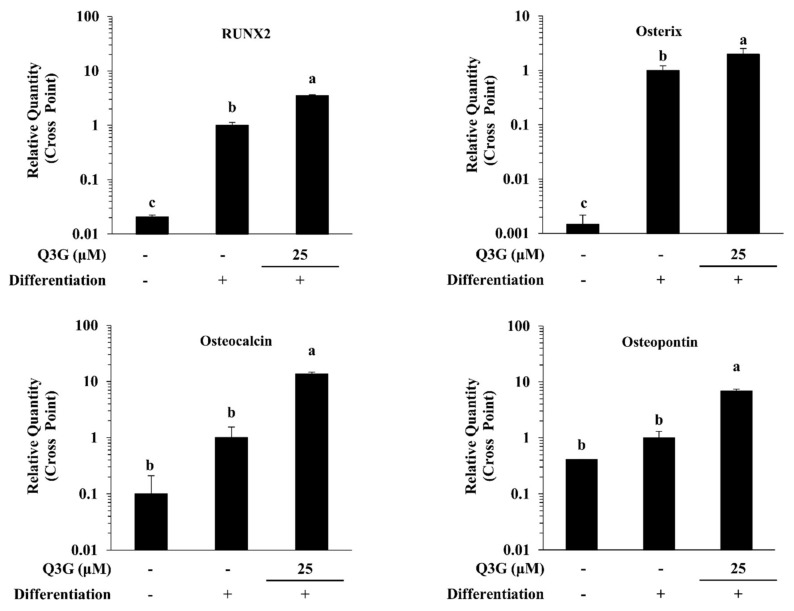
Figure 3.
Effect of Q3G on osteoblastogenesis marker gene expression. Analysis of gene expression was carried by measuring mRNA levels of osteo-induced hBM-MSCs via RT-qPCR at day 10 differentiation. Values are normalized against β-actin as internal loading control. Osteo-induced hBM-MSCs were treated with Q3G until day 3 of differentiation. Different letters (a–c) indicate statistically significant difference (p < 0.05).

