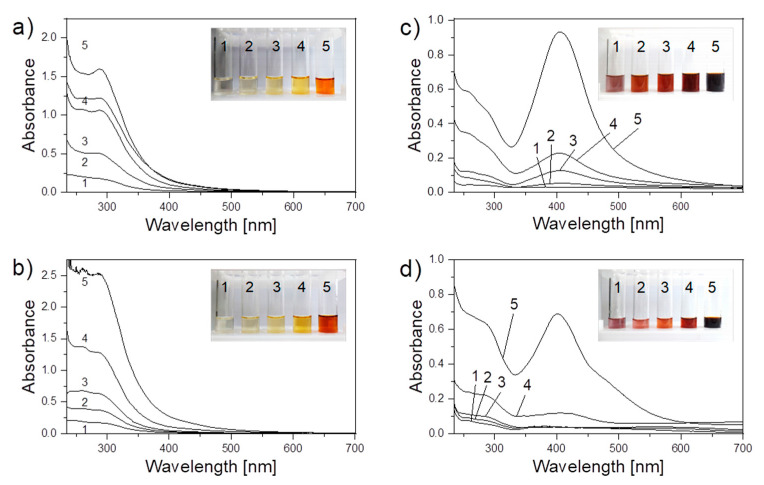
Figure 3.
UV–VIS spectra of blank chitosan solution (left) and chitosan/AgNO3 solution (right) after the plasma processing by discharge with (a,c) liquid anode and (b,d) liquid cathode during the following: 1, 0 min; 2, 5 min; 3, 10 min; 4, 15 min; and 5, 30 min. The photos of solutions as they are attached as inserts.

