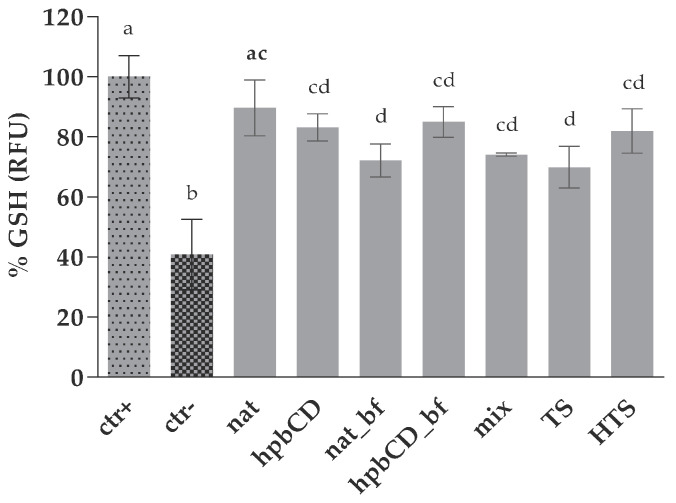
Figure 3.
Protective effect of OPEs and pure polyphenols against oxidative stress on HepG2 GSH content. Data are presented as mean ± standard deviation (n = 3) of the relative fluorescence units (RFU) calculated according to Equation (2); Positive control cells (ctr+) were treated with PBS while negative control cells (ctr−) were treated with tBOOH. All the other cells were treated both with samples and tBOOH. The final concentrations of the samples in wells are noted in Table 1. Different letters (a, b, c, d) indicate statistically significant differences compared to ctr+ (p < 0.05). Native olive pomace extract (nat), olive pomace extract with hydroxypropyl β-cyclodextrin (hpbCD); bioaccessible fraction (bf), tyrosol (TS), hydroxytyrosol (HTS), TS and HTS in the same concentration as in native sample (mix).

