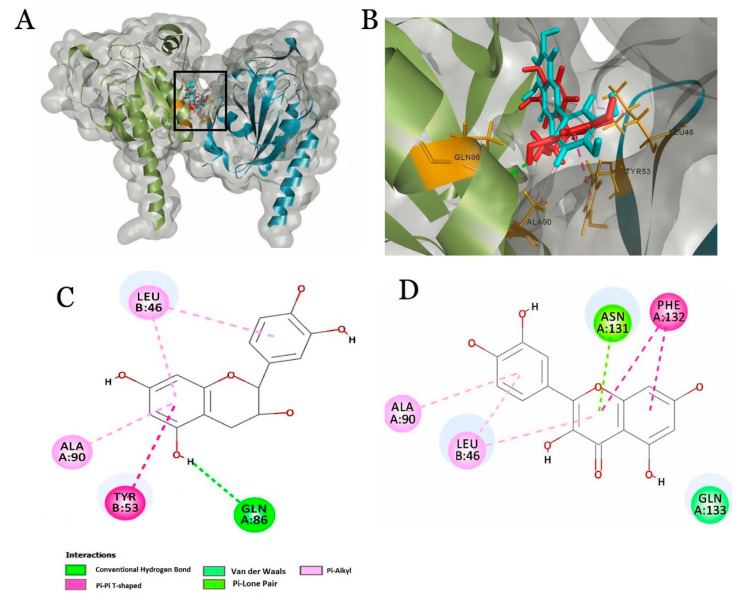
Figure 3.
Interaction analysis with glutathione peroxidase 3 (GPX3) protein. (A) The black box represents the binding pocket of the tetrameric protein. (B) Expanded view shows ligand interaction with the amino acids in the binding pocket; 2D plot representing the amino acid interaction with epicatechin (C) and quercetin (D).

