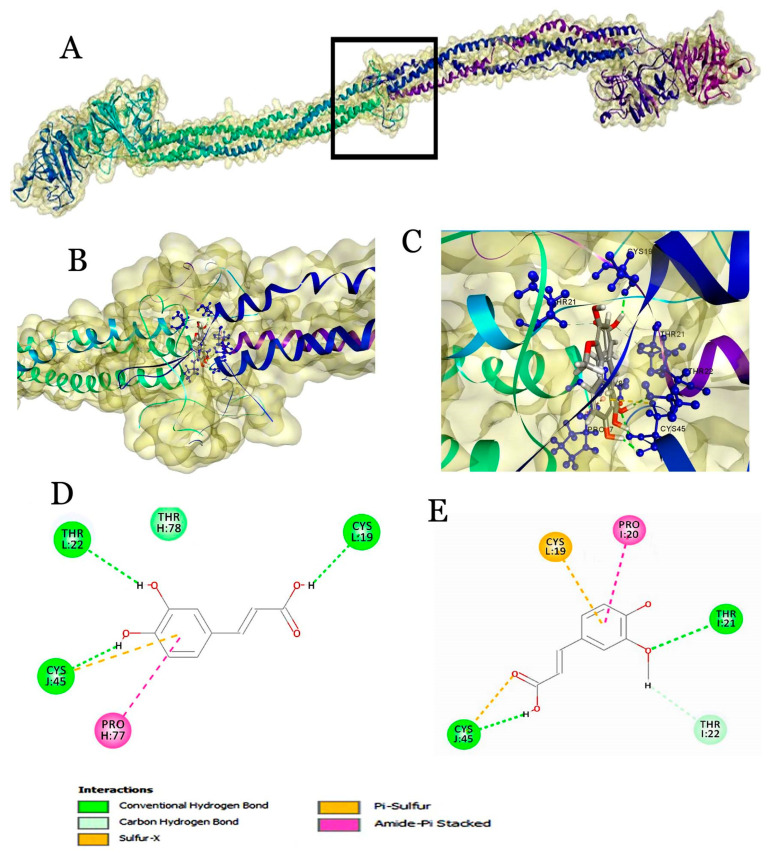
Figure 4.
Molecular docking of ligands with fibrinogen. (A) Surface view of fibrinogen representing the central nodule (black box) present in the E region; (B) Expanded view of the central nodule. (C) Interaction of ligands with the binding pocket amino acids of fibrinogen; 2D plot showing interaction with caffeic acid (D) and ferulic acid (E).

